Letters From The Earth
An experiment in translating climate signals into daily expressions
Rethinking How We Experience Data
Data is everywhere. We have become excellent at collecting it, storing it, analyzing it, and optimizing it. Yet almost nothing has changed in the way human beings experience it.
For decades we have relied on the same modalities: numbers, charts, dashboards, spreadsheets. These formats work beautifully for analysts. But they flatten data into forms that only certain people know how to interpret. Data becomes something you must decode rather than something you can relate to.
If data is becoming central to how decisions are made, why can't more people participate directly in understanding it?
Artificial intelligence offers a chance to explore this question: not as a tool for faster analysis, but as a medium for inventing new modalities of data expression. That idea became the foundation of Letters From The Earth.
Why Climate Became the First Test Bed
To test whether data could be translated into expressive forms, I needed a domain that was familiar and rich: something people encounter daily, that carries emotional resonance, that varies by place and time.
Climate emerged as that domain. It is universally relatable, globally structured, and inherently sensory. Full of texture, mood, and atmosphere. Yet most people only experience it through icons and numbers.
A number can tell you a temperature. A forecast can tell you a probability. But neither tells you how a place feels.
If the Earth could describe its own day using the same signals we collect about it, what would it say?
That inversion, the Earth writing back, is where the project began. Hence, Letters From The Earth.
The Core Hypothesis
At the center of Letters From The Earth is a single belief:
Data contains expressive qualities beyond analytics, and AI can translate those qualities into new modalities that invite more people to participate in understanding and meaning.
From this belief grew several concrete bets:
If data can speak through mood, metaphor, texture, or narrative, then people who are not analysts can still connect with it. They can sense what the data implies even without technical training.
You do not need full climate models to express how a region feels today. Subtle changes in temperature, clarity, moisture, wind, or surface patterns can provide enough grounding for expressive translation.
A desert reacts differently to the same conditions than a coastal city or a tundra. A mangrove has a different daily mood than a mountain snowfield. Data encodes these differences, and expressive outputs should reflect them.
Letters are not "the" answer. They are the first experiment. The engine can also support poems, haikus, symbolic visuals, sensory maps, or formats not yet invented.
Climate is merely the opening chapter.
The Translation Engine
The engine translates raw climate signals into first-person letters, covering 103 locations daily and achieving full global coverage every 16 days.
The pipeline compresses quantified data into archetypes, pairs them with biome-specific vocabularies, and generates prose under strict constraints: no statistics, no moralizing, no weather-report openings.
Temperature & deviation
Humidity & moisture
Wind patterns
Air clarity
Anomaly detection
Qualitative archetypes
Emotional register
Biome-specific lexicon
Locked constraints
Human curation
Daily Letter (90-130 words)
Pulse Line (1 sentence)
First-person voice
Biome as narrator
Ambient soundscape
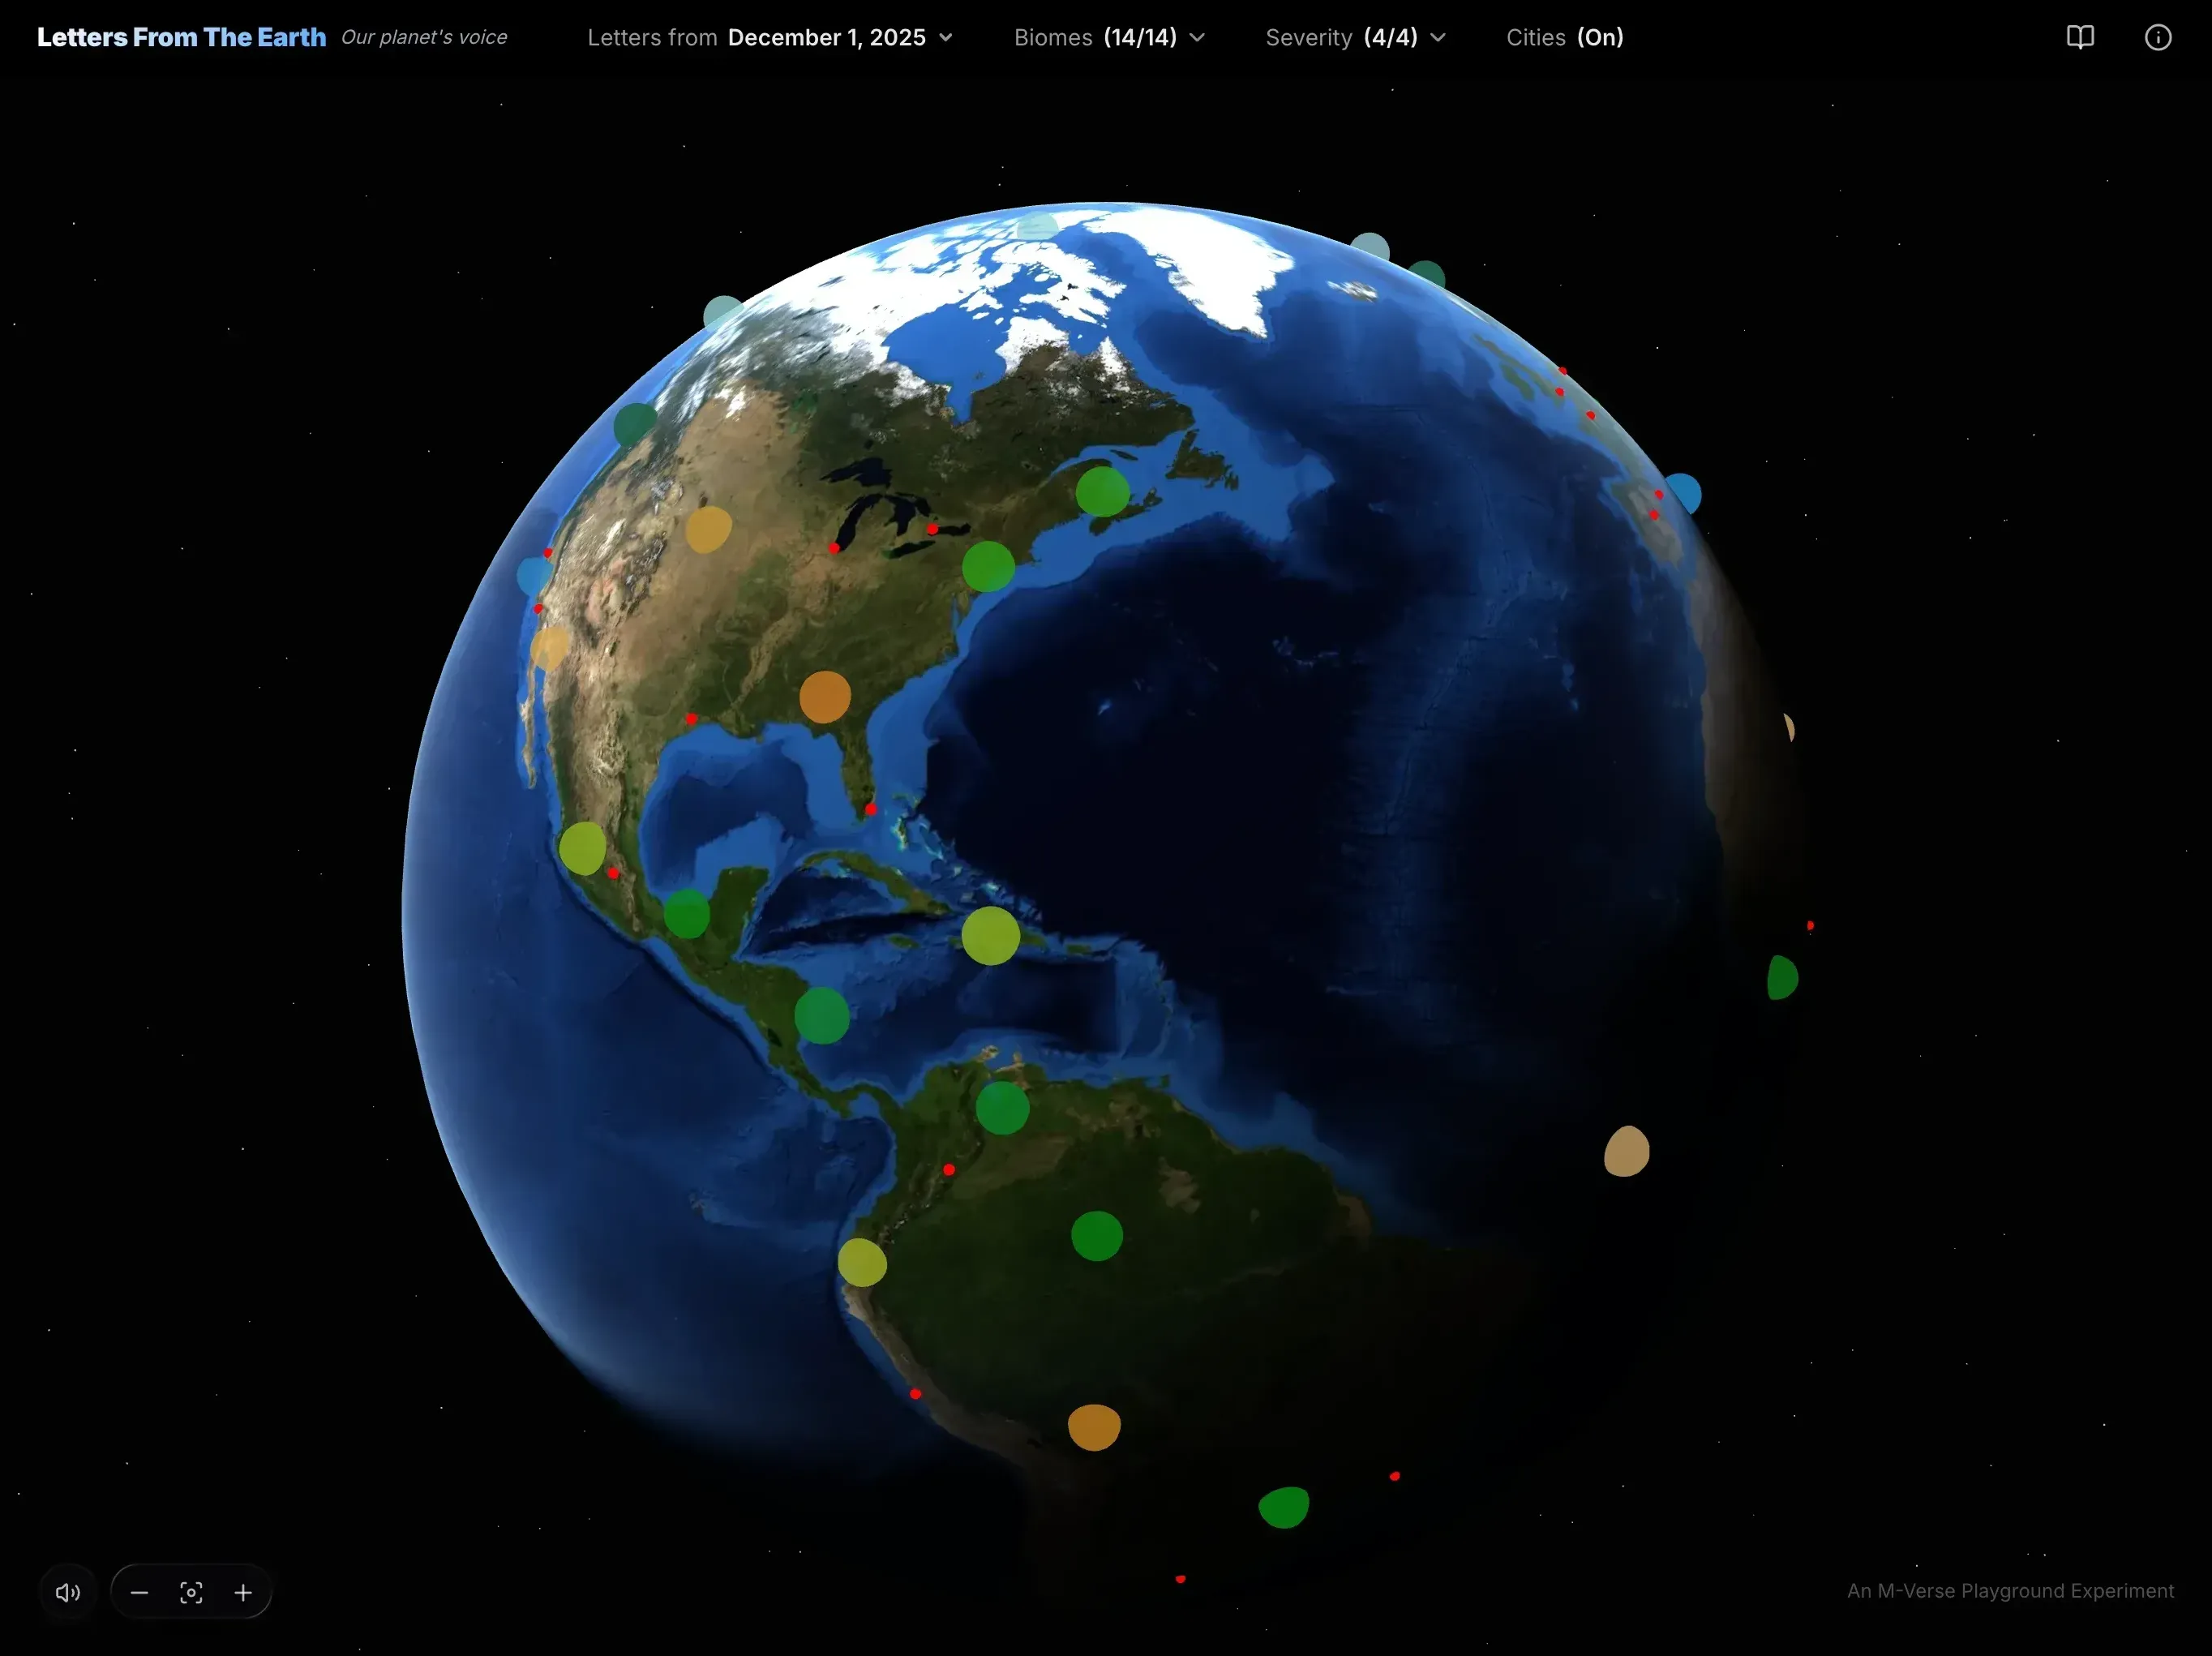
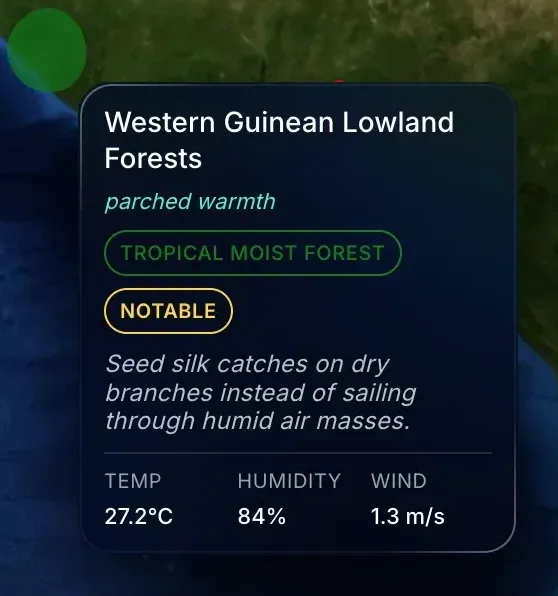
The Daily Letter
When a region or city is selected, the letter appears: a 90-130 word expression written in the voice of the place itself.
The letter is designed to read like a message from a friend describing their day, except the narrator is a living biome. Each one begins with microscopic physical evidence (a cracking seed pod, a shivering bird, a drying mud patch) before expanding to the wider landscape.
Constrained Generation
The AI operates under locked constraints. No statistics. No units. No direct address to the reader. No weather-report openings. No moralizing. The voice must be first-person present tense, the biome speaking as itself.
A Note on Metrics
The interface does show temperature, humidity, and wind speed as numbers, the very format the project argues against. This is intentional. The letter creates the primary experience; the metrics exist for those who want to ground-truth or compare.
The hypothesis is not that numbers are bad. It is that they should not be the only way data speaks.

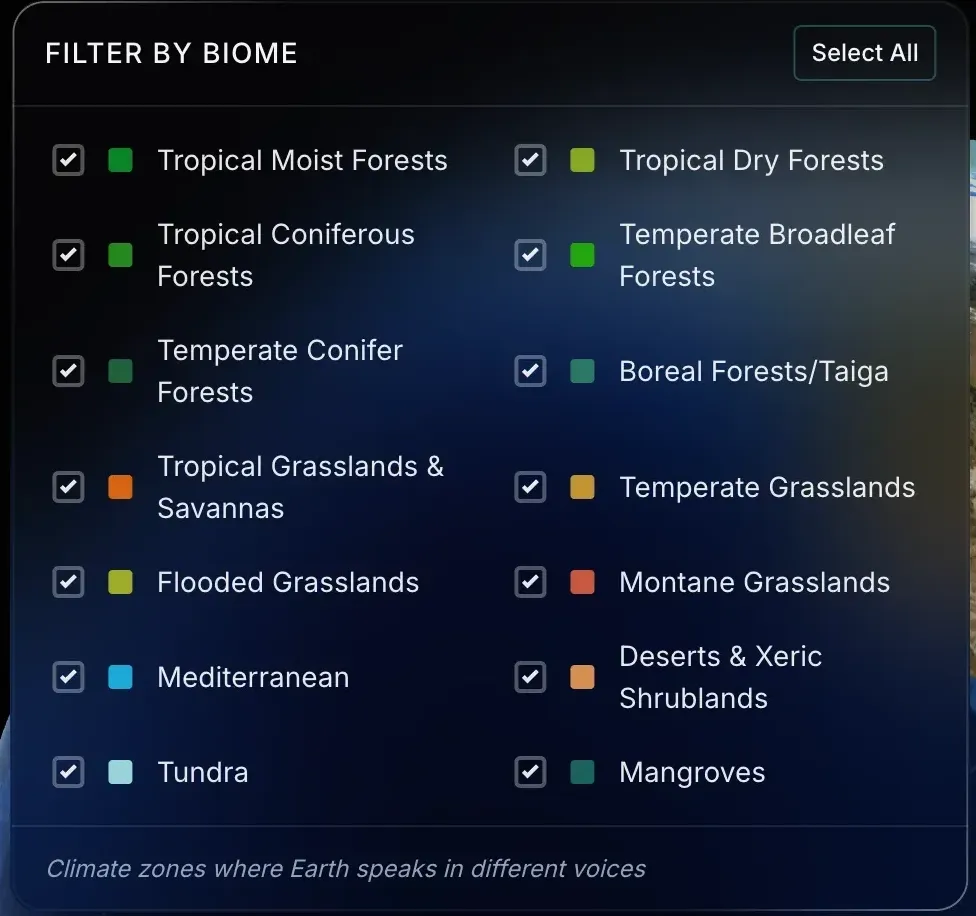
Filtering the World
The interface allows filtering by biome and severity, ways to navigate 848 ecoregions without overwhelm.
By Biome
Fourteen ecological categories from tropical moist forests to tundra, each with its own voice and vocabulary. A mangrove speaks differently than a Mediterranean scrubland.
By Severity
Filter from calm days (normal variation) to extreme departures (major disruptions). Severity reflects how unusual the day's signals are compared to 30-year baselines.
By Date
Browse letters from previous days. Each day's archive remains accessible, building a temporal record of how the planet has been speaking.
Modality-First Architecture
Narrative is not the end goal of the project. It is simply the first modality, the opening door.
Narrative works as a starting point because stories are the oldest human interface. People understand rhythm and tone without training. Letters create continuity and emotional presence. Regions can have "voices" that evolve over time. Narrative forms a bridge between raw signal and intuitive meaning.
But the underlying architecture is modality-agnostic. A single semantic core (daily climate signals) feeds a transformation engine decoupled from the output format. The same emotional archetypes, anomaly weights, and biome signatures that generate a letter could generate something else entirely. The constraint system that governs tone and voice is not bound to prose. It is bound to meaning.
This pattern may have implications beyond climate. It suggests a general approach to data expression where the transformation layer sits between raw signal and human experience. Whether it transfers cleanly to other domains remains an open question. Narrative may not serve contexts where people need to act quickly. But for data that benefits from being understood rather than scanned, expressive modalities may offer something new.
I do not yet know which domains this pattern serves best. Climate was the first test bed. Others will follow.

The Question of Pull
This experiment does not yet answer the question of pull.
People read dashboards because they must act. People listen to podcasts because listening requires no effort. Text letters sit in an awkward middle. They ask for attention without providing necessity.
The hypothesis is that the quality of the expression can create its own pull. That a letter from the Sunda Shelf mangroves, written well enough, might make someone pause and feel something they would not have felt from a number.
But text demands effort. And effort requires motivation.
Audio would lower the effort barrier.
If a region can write its day, it could also speak it. The power of audio lies in presence, intimacy, pacing, and the ritual of listening. Imagine receiving a spoken letter from the tundra each morning, or hearing a coastal city's whisper at dusk. Audio would allow for a deeper relationship with place, one that unfolds in time rather than on a screen.
The practical limitations today are real. Generating hundreds of expressive voices daily is expensive. High-quality text-to-audio models have meaningful per-generation costs. Scaling this sustainably is not possible at the moment.
The system is designed to support audio when costs become manageable. Today, the project includes biome-specific ambient soundscapes. You can hear the texture of a place even if you cannot yet hear its voice.
Audio remains the next horizon.

Closing Reflection
Letters From The Earth is not a climate product. It is not a scientific tool. It is not an attempt to replace dashboards or metrics.
It is an exploration of expression.
It is a test of whether data can step outside analytical containers and speak in ways that feel human, atmospheric, poetic, or emotional. It is a probe into shared meaning, not for analysts, but for anyone who lives in the world.
If data could speak in more human ways, who else might listen?
Today, the Earth wrote to 103 places. Tomorrow it will write again.